Commercial Solar PV — how it actually pays back.
A practical guide for energy, finance and operations leaders weighing rooftop or ground-mount solar on UK commercial sites.
Commercial solar PV pays back when the system is sized against your real half-hourly demand — not your annual kWh total. On UK commercial sites, well-designed rooftop arrays typically deliver 3–6 year payback, 25+ years of generation, and a 20–40% reduction in grid imports. The risk is buying generic capacity that exports cheaply instead of offsetting expensive import.
What Commercial Solar PV actually is
On-site photovoltaic generation — panels, inverters and balance-of-system — sized to a building's daytime demand profile and connected behind the meter so every generated kWh displaces an imported one.
A generic 'put solar on the roof' commodity. The economics live or die on how the system matches your half-hourly load, your tariff structure, and your roof or land constraints.
- kWp (kilowatt-peak)
- The rated DC capacity of the PV array under standard test conditions. A 100 kWp system typically generates around 85–95 MWh per year in the UK.
- Half-hourly (HH) data
- Your supplier's record of grid imports in 30-minute intervals. The single most useful input for sizing solar correctly.
- Self-consumption ratio
- The share of generated energy used on-site rather than exported. Higher = better project economics.
- MPAN
- Meter Point Administration Number — the unique ID for your electricity supply point.
- DNO
- Distribution Network Operator — the regional grid operator who must approve any generation connection.
- Module degradation
- Linear performance loss over time. Modern Tier-1 modules degrade ~0.4–0.5% per year, with 25-year warranties at ~87% of nameplate.
How it works
Six checkpoints from data to commissioning. Scroll to step through each one.
- Step 01
Half-hourly demand analysis
We pull 12 months of HH data from your supplier and overlay it with site-specific solar yield modelling. This tells us the maximum system size that achieves high self-consumption — the number that drives payback.
- Step 02
Structural and electrical survey
Roof load-bearing capacity, condition, pitch, orientation, shading, cable runs, inverter location, MPAN headroom and DNO connection envelope are all assessed before a single panel is specified.
- Step 03
System design and DNO application
We design to a target self-consumption ratio (typically 70–90% for commercial sites) and submit the G99 or G98 application to your DNO. Connection terms shape the final sizing.
- Step 04
Procurement and installation
Tier-1 panels and inverters, sourced against your timeline and the project's funding model. Installation is sequenced around your operational calendar — out-of-hours, weekends or staged areas as needed.
- Step 05
Commissioning and monitoring
Every system is handed over with live performance monitoring at string level. Year-1 generation is benchmarked against the design — variance triggers immediate investigation.
Commercial impact
Solar PV produces a known commodity — kWh — at a fixed unit cost for 25+ years. That predictability is the financial story. The CFO question is not 'is solar good?' but 'is this specific system, sized this specifically way, on this specific tariff, NPV-positive?'
- 01
Payback windows of 3–6 years are achievable on UK commercial rooftops with current panel pricing and grid tariffs above 20p/kWh.
- 02
Levelised cost of energy (LCoE) from a well-designed rooftop system sits at 4–7p/kWh over 25 years — a fraction of grid import.
- 03
Generation is inflation-hedged: every grid tariff rise increases the value of every self-consumed kWh.
Operational impact
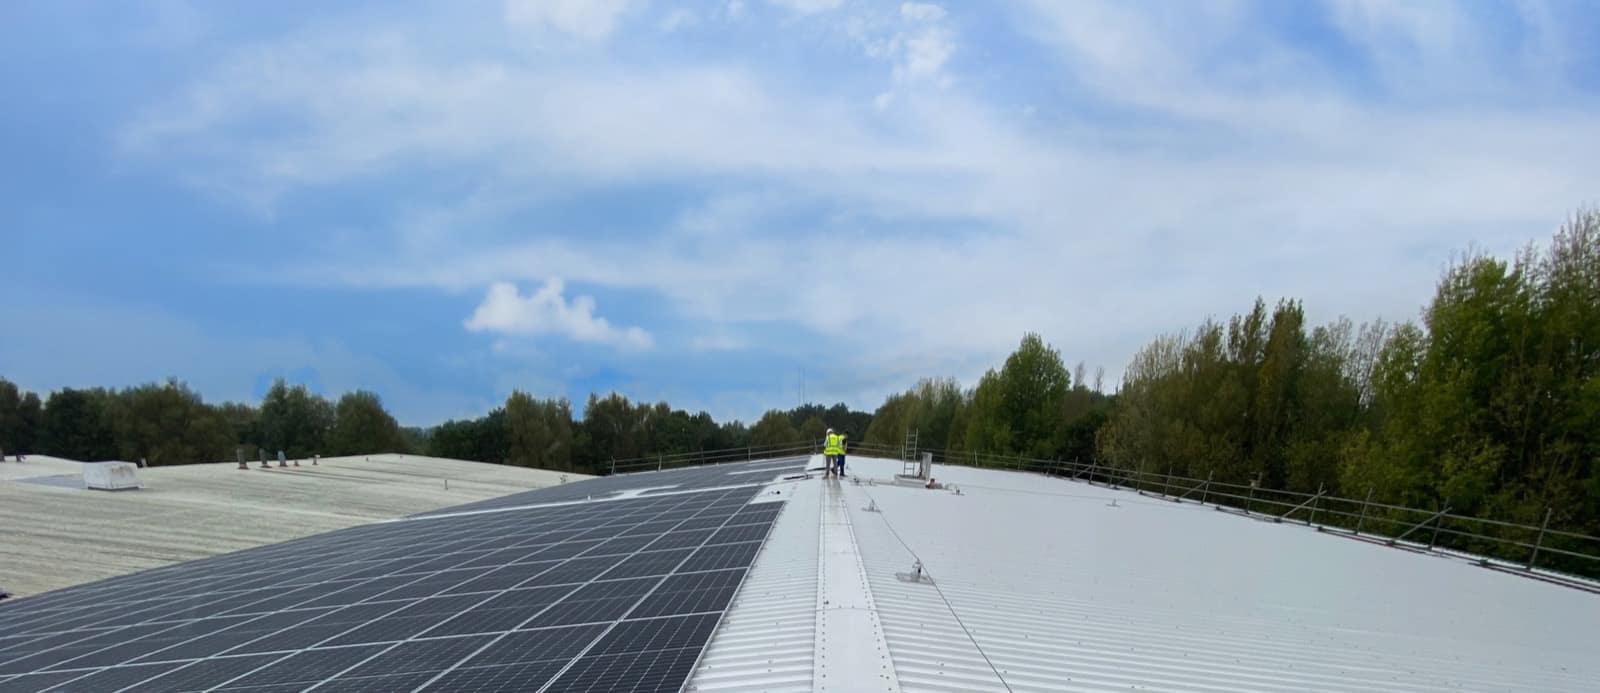
The biggest operational worry is the wrong one. Most directors fear disruption during installation; in practice, well-sequenced commercial solar installs cause near-zero downtime. The real operational question is what happens in years 3–25.
- 01
Rooftop installs on commercial buildings are typically completed in 4–10 weeks with zero internal access disruption.
- 02
Roof penetrations are minimised through ballasted or rail-clamped mounting systems where possible.
- 03
Inverter MTBF is ~15 years; expect one inverter replacement over a 25-year system life.
Risks — and how we de-risk them
We size against half-hourly demand data, not nameplate roof capacity. Oversized systems export at <5p/kWh and destroy payback.
Independent structural survey before design lock. Ballasted systems, lightweight modules and reinforced fixings used where loading is marginal.
Pre-application capacity check with the DNO before committing design. Battery storage, export limitation or phased connection used to land an approval.
Sensitivity modelling at 15p, 20p, 25p and 30p/kWh import scenarios. Payback survives historical lows; current tariffs offer significant headroom.
Asset Finance (lease-to-own) or PPA structures align cost to the lease period. EaaS removes the asset from the tenant entirely.
String-level monitoring with alerting on day one. Annual performance reports against design. Ongoing O&M contract for response SLAs.
How it gets paid for
Four ways to fund the same physical asset. Pick the one that matches your balance sheet and your time horizon.
A day in the life of a well-sized array
Generation rises with the sun, demand sits underneath it. The shaded area is self-consumption — the only kWh that earn full retail value.

How this stacks up against the alternatives
Solar PV is one of several ways to reduce grid spend. Here's an honest comparison.
| Solar PV | Behind-the-meter battery only | Better grid tariff | Do nothing | |
|---|---|---|---|---|
| Reduces import cost | Yes — 20–40% | Small — arbitrage only | Yes — variable | No |
| Reduces Scope 2 carbon | Yes — directly | No — energy still imported | Only via grid mix | No |
| Inflation hedge | Strong (25 yrs) | Partial | No — re-prices | No |
| Capital required | £ or zero (PPA/EaaS) | ££ | Zero | Zero |
| Operational disruption | Low | Very low | None | None |
| Typical payback | 3–6 yrs | 5–10 yrs | Immediate but ongoing | n/a |
Questions buyers actually ask
Selected projects
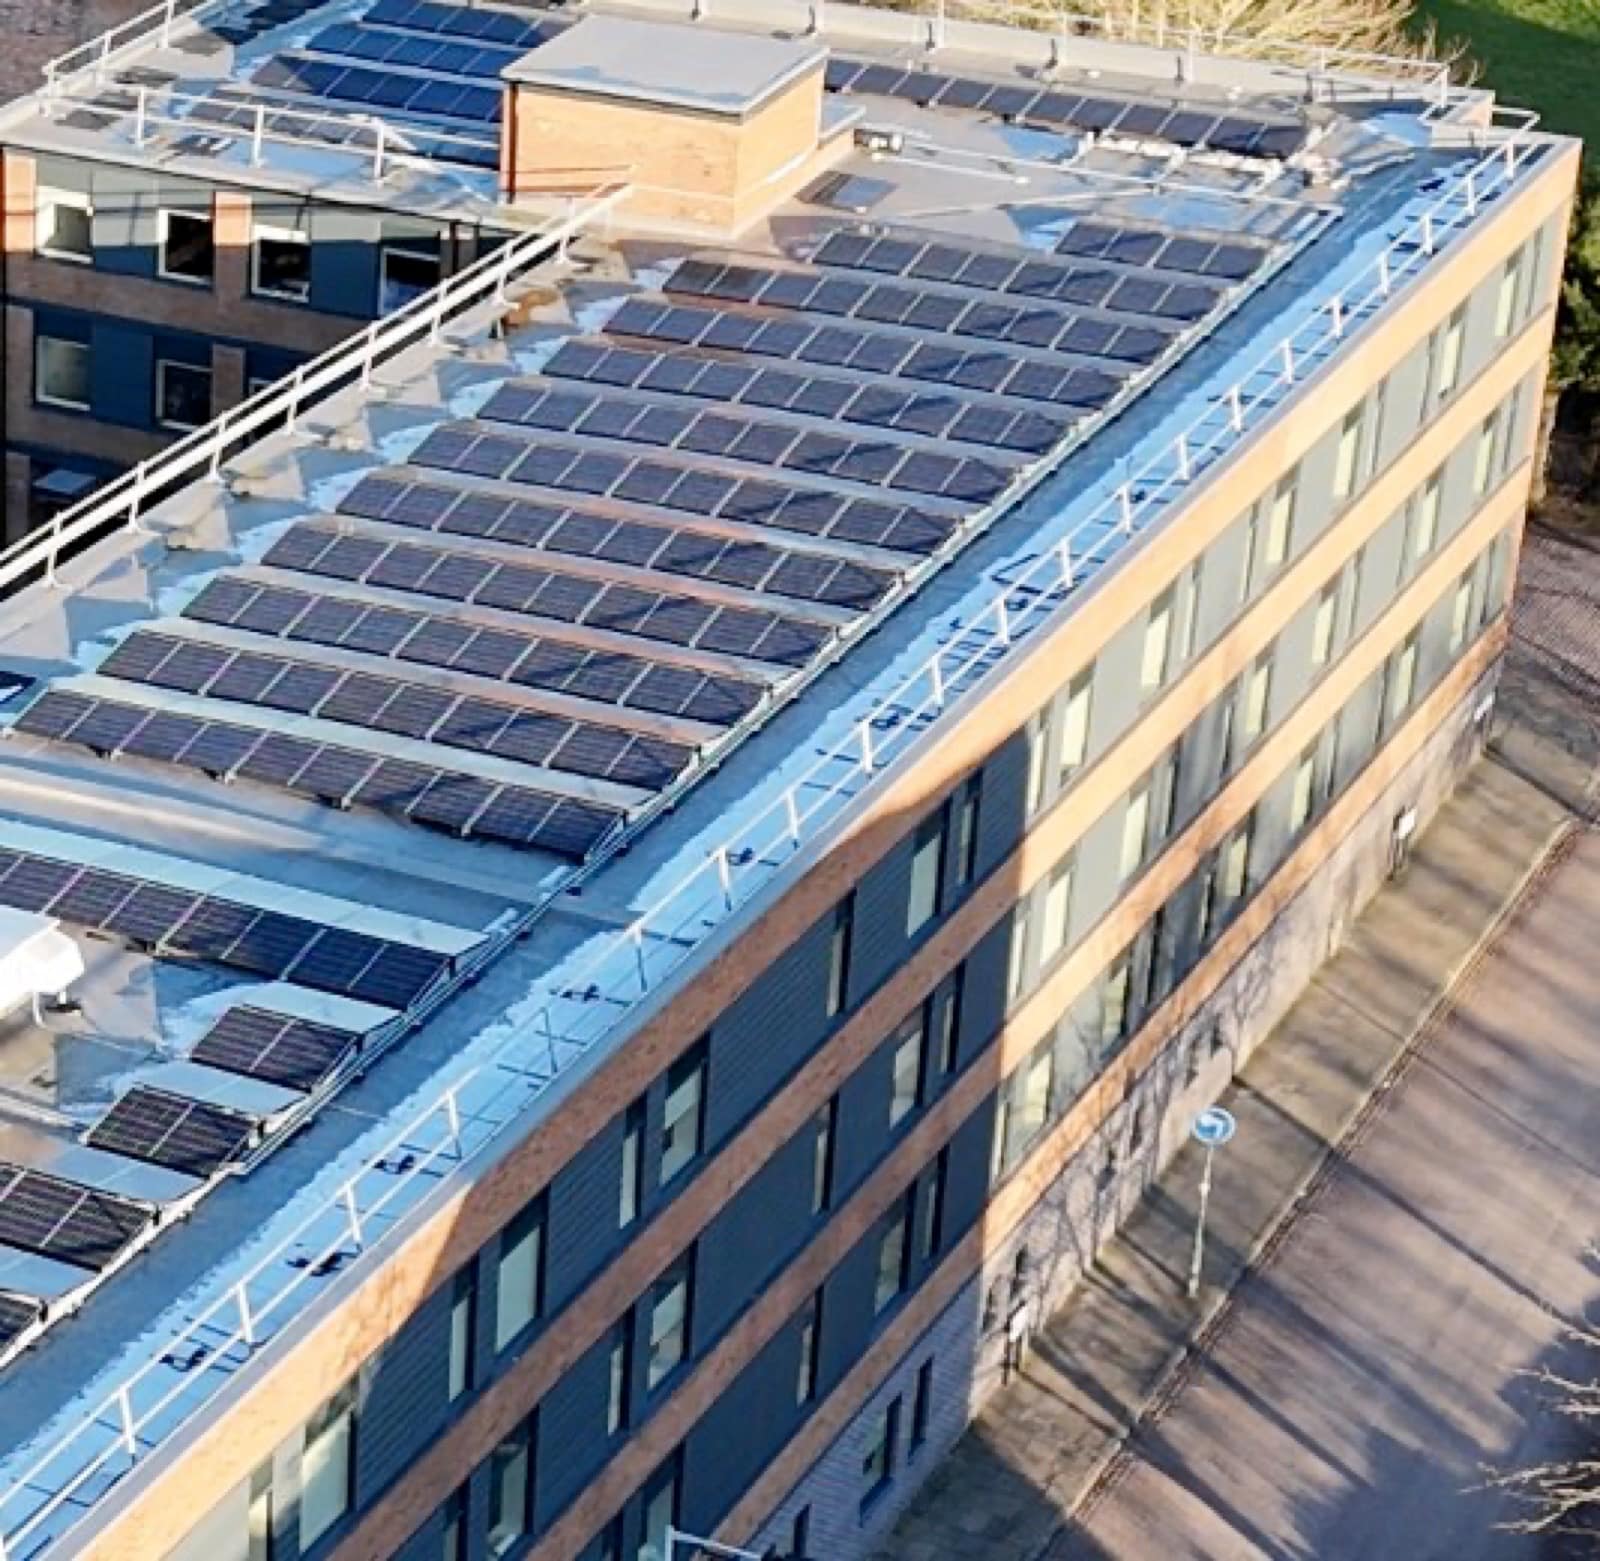
Marston's PLC
Sustainability initiative — headquarters and Phase 1 solar installation across Marston's hospitality estate, delivered with HT Power PPA support.
- System size
- 114.38 kWp
- CO₂ saved
- 17.44 T
- Payback
- 4 years
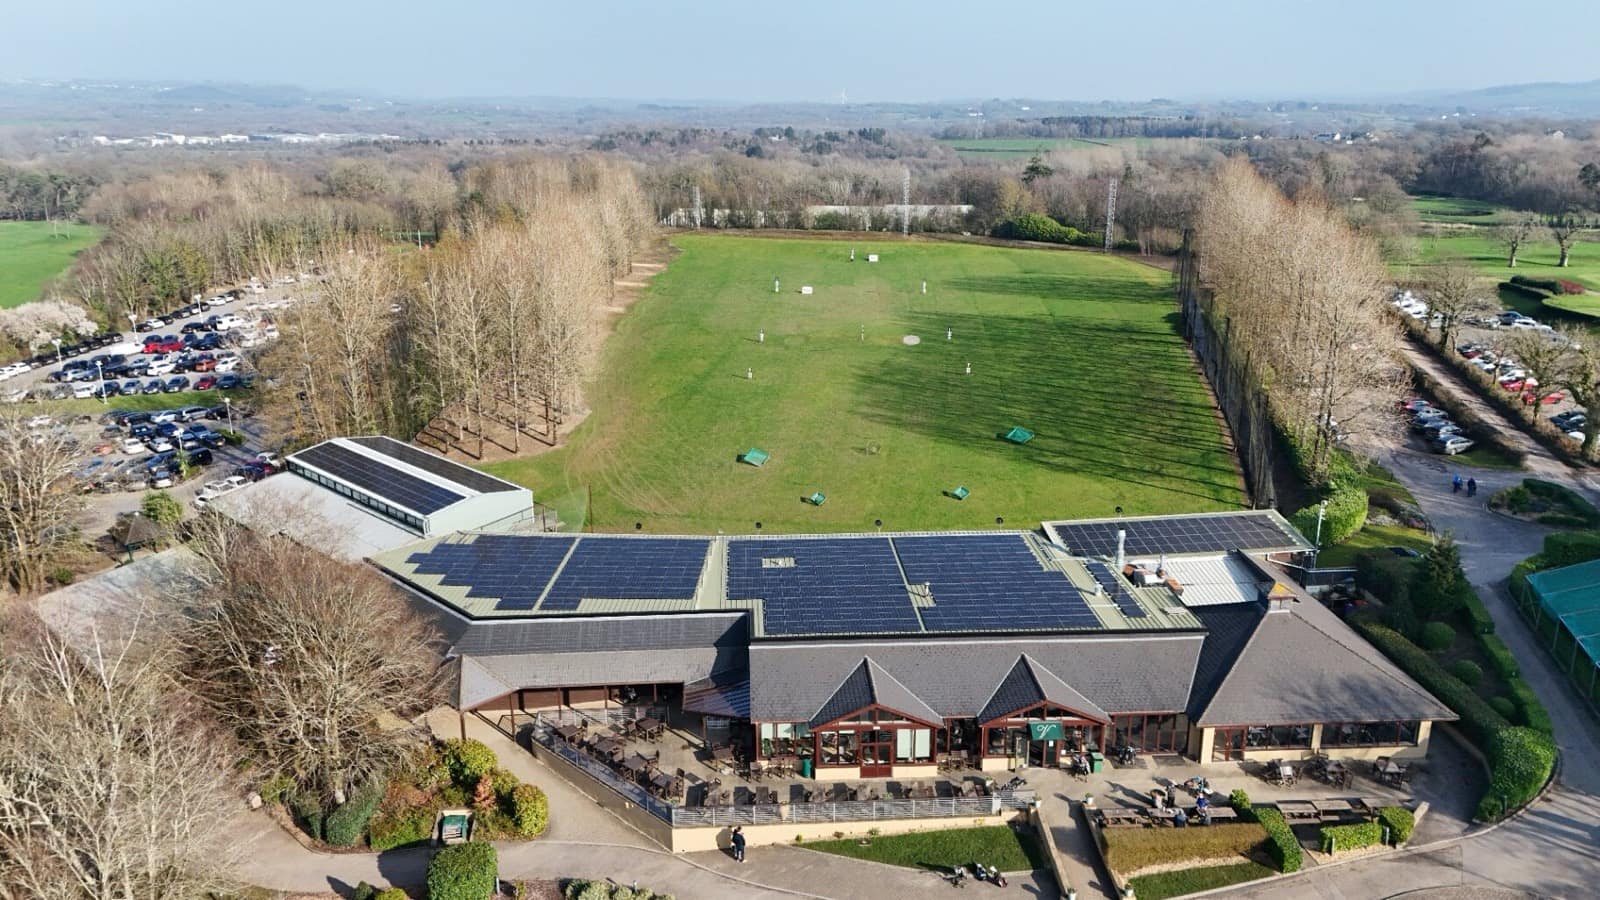
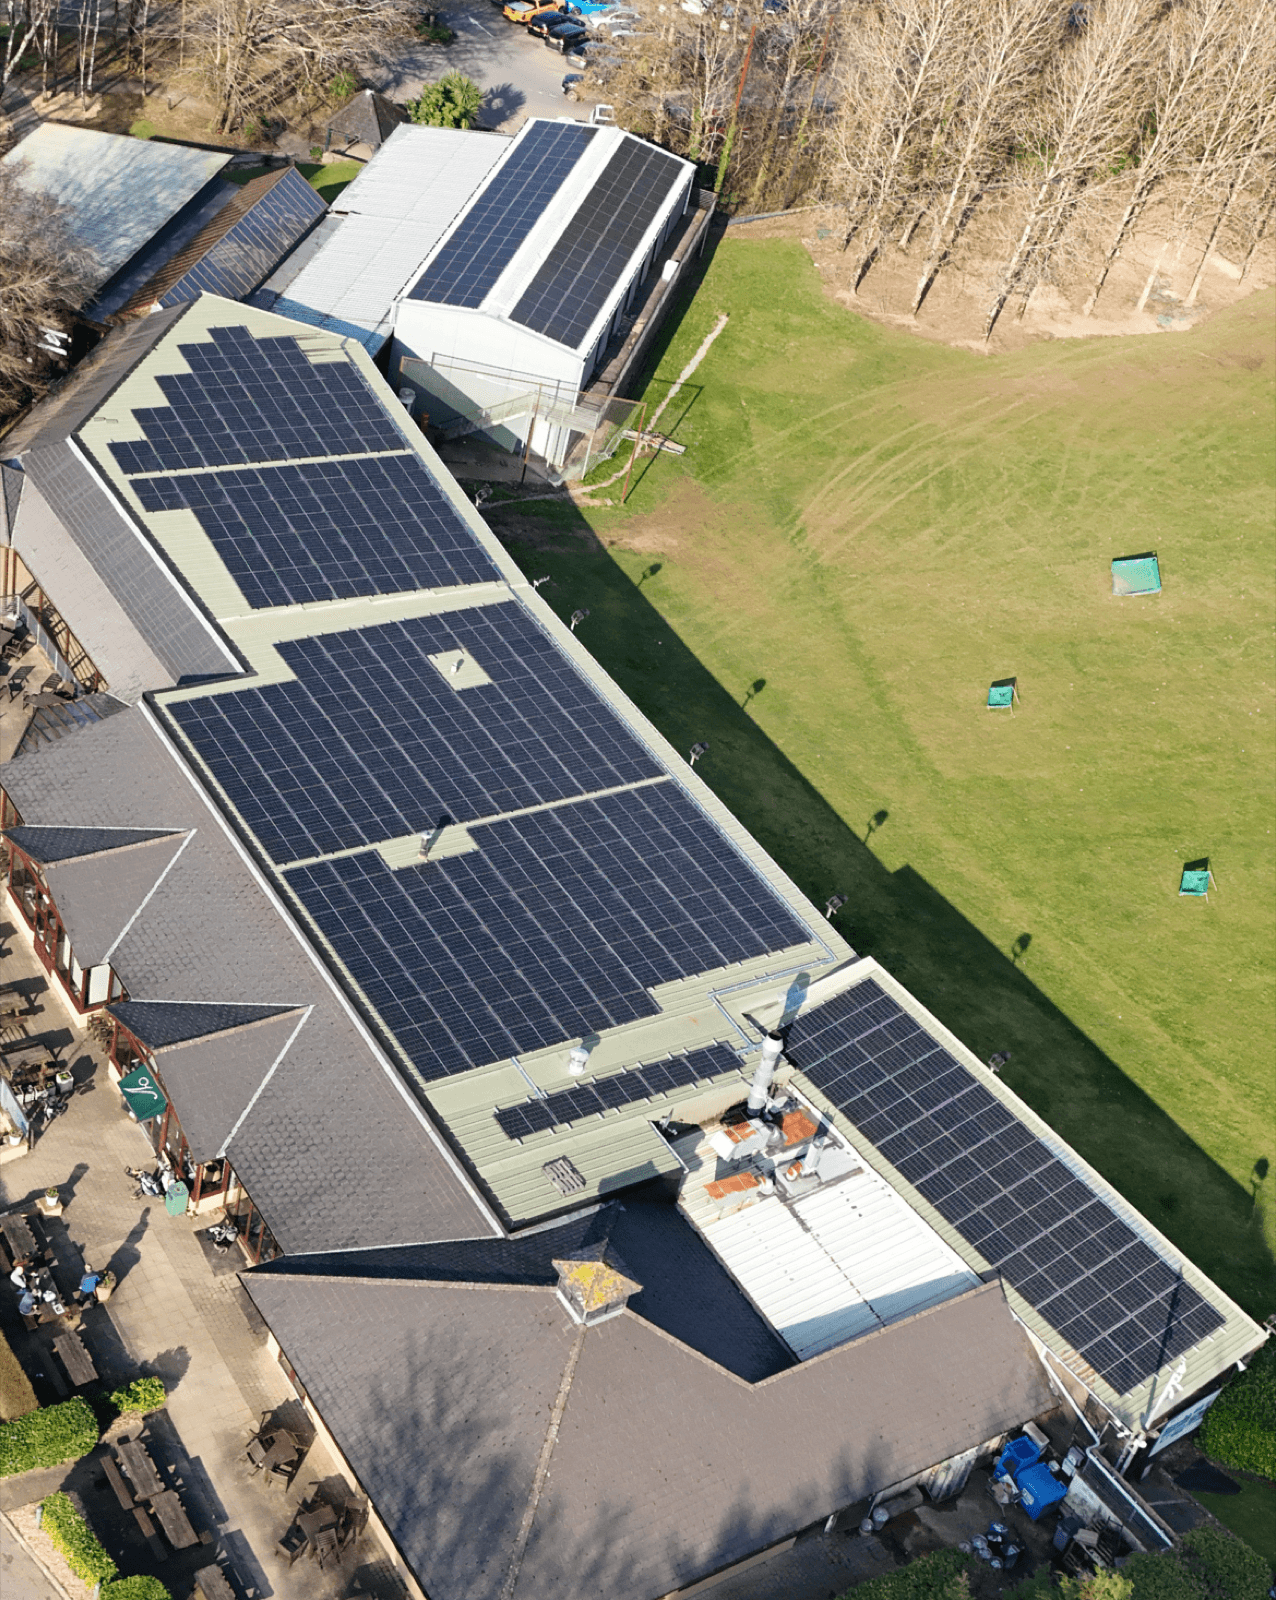
The Vale Resort
Solar PV plus EV charging delivered live across a working luxury resort and golf club.
- System size
- 168.81 kWp
- Year-1 savings
- £43,049.60
- CO₂ saved
- 28.8 T
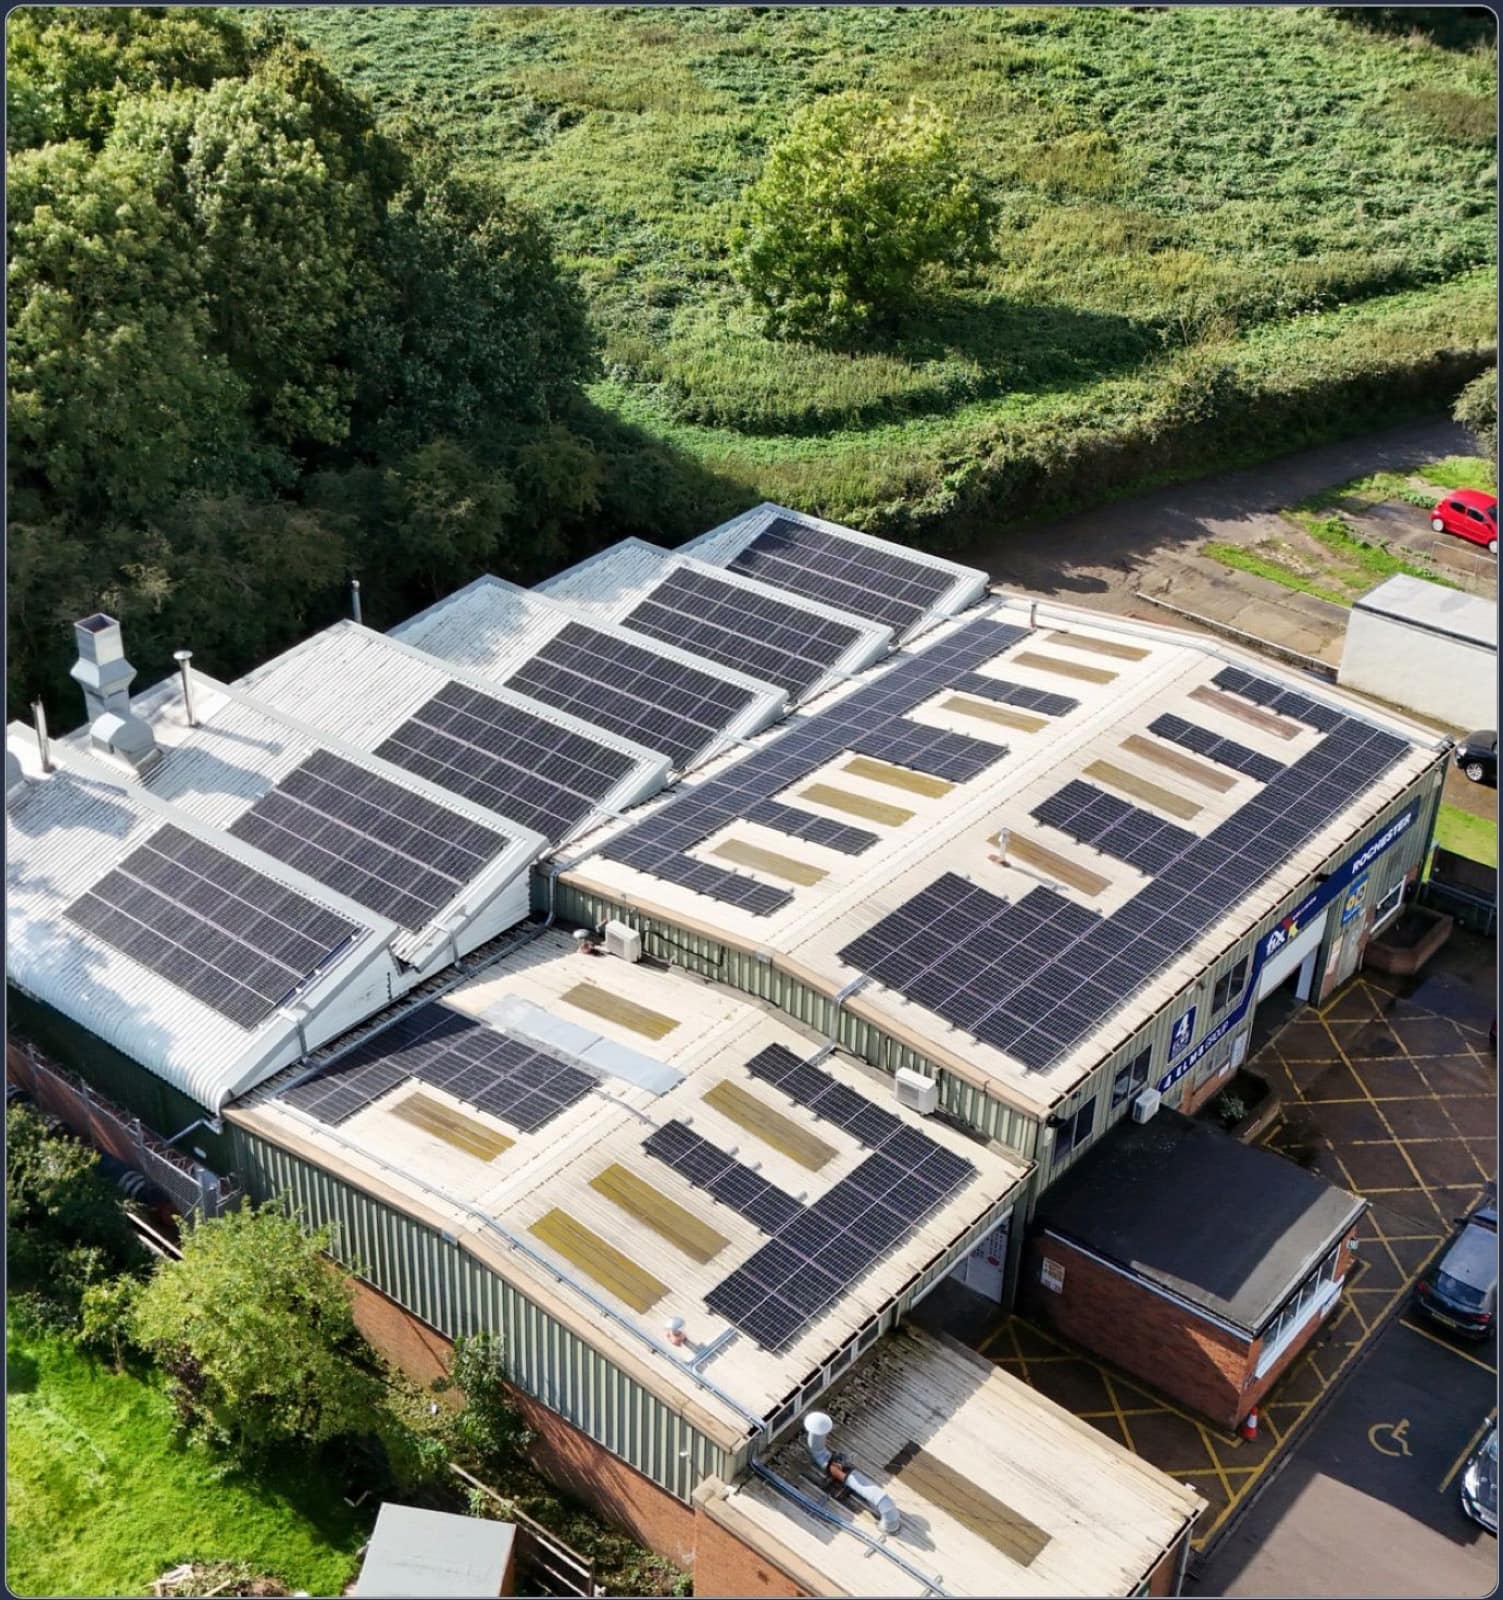
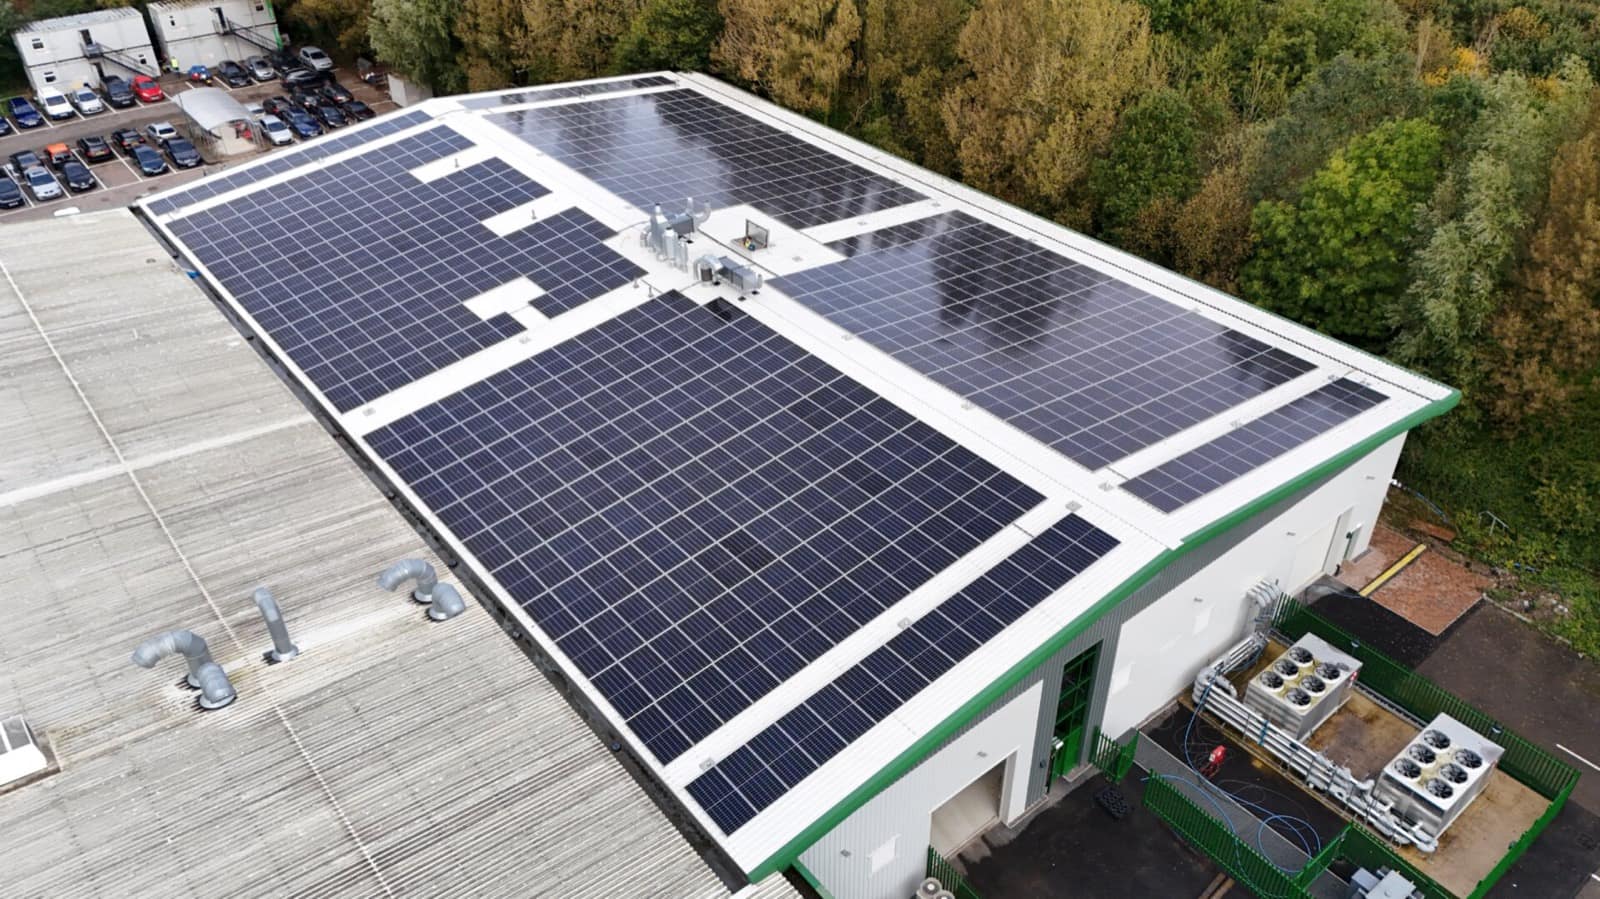
Four Elms Group
Solar PV across a UK network of automotive repair and accident management centres.
- System size
- 117.45 kWp
- Year-1 savings
- £33,632
- Payback
- 3 years
Related solutions
Battery Storage
Pair storage with solar — or run it standalone — to optimise tariffs, resilience and grid revenue.

EV Charging
Full consultancy, installation and maintenance for charging at any scale, integrated with on-site generation.

Energy-as-a-Service
We design, build, fund and operate your energy assets. You pay a fixed unit rate and start saving from day one.
Ready to model your numbers?
Five quick questions and our team will come back with a tailored proposal — CAPEX, finance, PPA or fully funded.